Metrics are persuasion
Dan Murphy, September 01 2024

The man himself.
The first principle is that you must not fool yourself – and you are the easiest person to fool.
- Richard Feynman
Welcome to part 3 of this series on metrics:
- Metrics are conceptual compression - Metrics almost unavoidably reduce the amount of information available. This has both positive and negative implications.
- Metrics are incentives - People love to set targets, people love to hit targets. What will they do to hit those targets? Is it what you want them to do?
- Metrics are persuasion - Metrics created and interpreted by medical doctors, scientists, and economists are often misleading. Are you sure yours are fine?
- Metrics are powerful - After three posts of me telling you how dangerous and hard to get right metrics are, I tell you metrics are sometimes very useful. With great power comes great responsibility, as they say.
The quote above is from Richard Feynman’s famous “Cargo Cult Science” speech at Caltech in the 1970s.
In it he cautions the crowd of scientists-in-training against the temptation to oversell their research findings. To convey more confidence than is really warranted by the evidence. To selectively show some results and not others, for fear of displeasing their audience or financial supporters.
In short, Feynman is calling out an uncomfortable truth: it’s easy to make convincing arguments by claiming to be scientific, but it’s much more difficult to actually run a rigorous scientific process.
And perhaps the greatest difficulty is not in being honest with others, but in being honest with yourself.
When you have a great deal of data at your disposal, and full liberty to analyze it however you please, you have many opportunities to look at the data in such a way that it will tell you exactly what you want to hear.
Replication crisis
Many people have echoed sentiments similar to Feynman’s over the years, perhaps most powerfully John Ioannidis in his essay Why Most Published Research Findings Are False.
In it Ioannidis correctly called out the replication crisis, particularly in “soft science” fields such as psychology¹, where researchers have been unable to reproduce the results of many prior experiements, casting doubt on the validity of those experiments.
Ioannidis cites a combination of statistical, procedural, and incentive-based shortcomings in modern scientific practices that contribute to this lack of rigor.
The details of those shortcomings are interesting and important to understand, but what I’d like to highlight is the big picture: there are PhD educated scientists and medical doctors, writing in peer reviewed journals, conforming to standard statistical practices whose work often turns out to not be rigorous.
Motivated reasoning
Part of the problem called out by Ioannidis and others is simply a misalignment of incentives: the theoretical aim of science is to discover the truth, but the practical goal of many research studies is to find some version of the truth that is convenient for the people running the study.
Researchers want to publish papers that will get them noticed and get them tenure. Organizations funding studies want results that lend credence to whatever their point of view or vested interest is.
Is it really so different when we do data analysis at work? Sometimes we really are after the truth. We need to use data to find some insight or to figure out what’s going on, or we’ll go out of business.
But other times the same incentive-caused biases creep in. We really want our recent feature launch to be a success. We really want customers to need what we’re selling.
And so we find just the right way to slice the data to make it so. If at first our analysis doesn’t reveal success, perhaps we look a little harder.
If a particular way of analyzing the data turns out not to support our desired result, we may be quick to invent reasons to dismiss it (this is “desk drawer bias”, where we only publish results that are interesting or that say what we want to hear).
Nate Silver illustrates this perfectly with his p-value hacking website.
It's easy, just re-analyze the data until you get the result you want!
Given enough data with enough dimensions, you often can create whatever “significant” conclusion you want².
A common remedy to this in science is to “pre-register” the results of your study. This simply means that you announce ahead of time how you’re going to analyze the data, which attributes are under consideration and which are not, what the criteria for success are.
This removes the temptation to after the fact look for any conceivable way you can slice the data to convey the message you want to hear³.
Insignificant significance
In general people probably read too much into the meaning of a “significant” result.
Statistical significance has a very specific definition that has to do with the likelihood of false positives and false negatives.
It does not mean that the result is “significant” in the everyday meaning of the word. That is, it does not mean that the result matters. You need common sense to tell you that.
Maybe eating corn during childhood leads to a “statistically significant” difference in height of 0.0001 inches (the “effect size”) in adulthood.
A sufficiently powered (large sample size) study can detect any effect size, even if it’s merely random noise in the data, or is irrelevant practically speaking.
If you have reams of data at your disposal and are running p-value based experiments beware a gargantuan sample size capable of considering any effect size to be significant.
The curse of data
Many people today are familiar with the idea of confirmation bias. This is some part of human nature that makes it easy for us to see information that corroborates what we already believe, but hard to see information that contradicts those beliefs.
Nassim Nicholas Taleb argues that there is so much information readily available today you almost assuredly can find evidence confirming whatever belief you - consciously or subconciously - want to justify.
This is the dark side of the era of “big data”. Just as you can read whatever news source you know will give you what you want to hear, given enough data and enough latitude to analyze it you can probably find whatever conclusion you want to be true.
Taleb encourages us to try the reverse: try to find the information disconfirming your argument.
This forces us to go against our natural confirmation bias, which is a difficult thing to do.
So it’s important to enlist the help of your teammates: make it a cultural habit to ask for disconfirming evidence when making big decisions based on data.
Annie Duke calls these groups of teammates “decision pods”, where everyone is focused on finding the truth, where social prestige is gained by seeking disconfirmation rather than fitting in by going with the flow.
If you can manage to establish those social norms you’ve gone a long way toward making it harder to deceive yourself with data.
Even if the search for disconfirming evidence doesn’t disprove or cast serious doubt on the overall theory it may still surface interesting edge cases or failure modes, and so is often an exercise worth doing.
Confounded!
An abundance of data and no constraints on how we analyze that data also makes it easy to slip into confusing correlation and causation.
Like confirmation bias, surely everyone has heard “correlation is not causation”, and yet it’s still easy - even for scientists - to confuse the two when making data-backed arguments!
Peter Attia gives a super relatable example in his blog post Is ditching meat a “game changer” for your health?
Attia is a doctor with a background in mathematics who has spent more time than most analyzing the literature on diet and exercise. His critique of most nutritional research is basically one of confusing correlation with causation.
The typical argument in favor of a specific diet is that people who eat it live longer or have lower levels of disease. The problem with that argument is that people who eat a specific diet - any specific diet - are just generally more health conscious than the average population.
Indeed there is a correlation between their chosen diet and their improved health outomes relative to the general population, but is the diet the cause of those improved outcomes?
Or did one of the many other factors correlated with their long lifespan cause it? How much did each factor contribute?
You can’t really say without conducting experiments that are extremely difficult to run over the long-term: try getting a large sample of people to consistently stick to a diet over many months or years, and to accurately report whether or not they did so⁴.
In diagram form the error is easy to see:
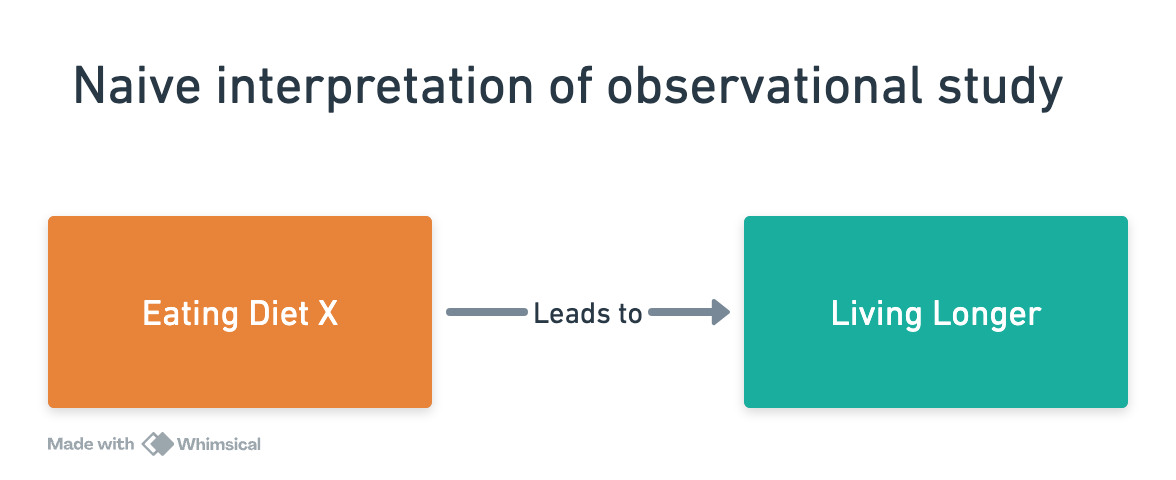
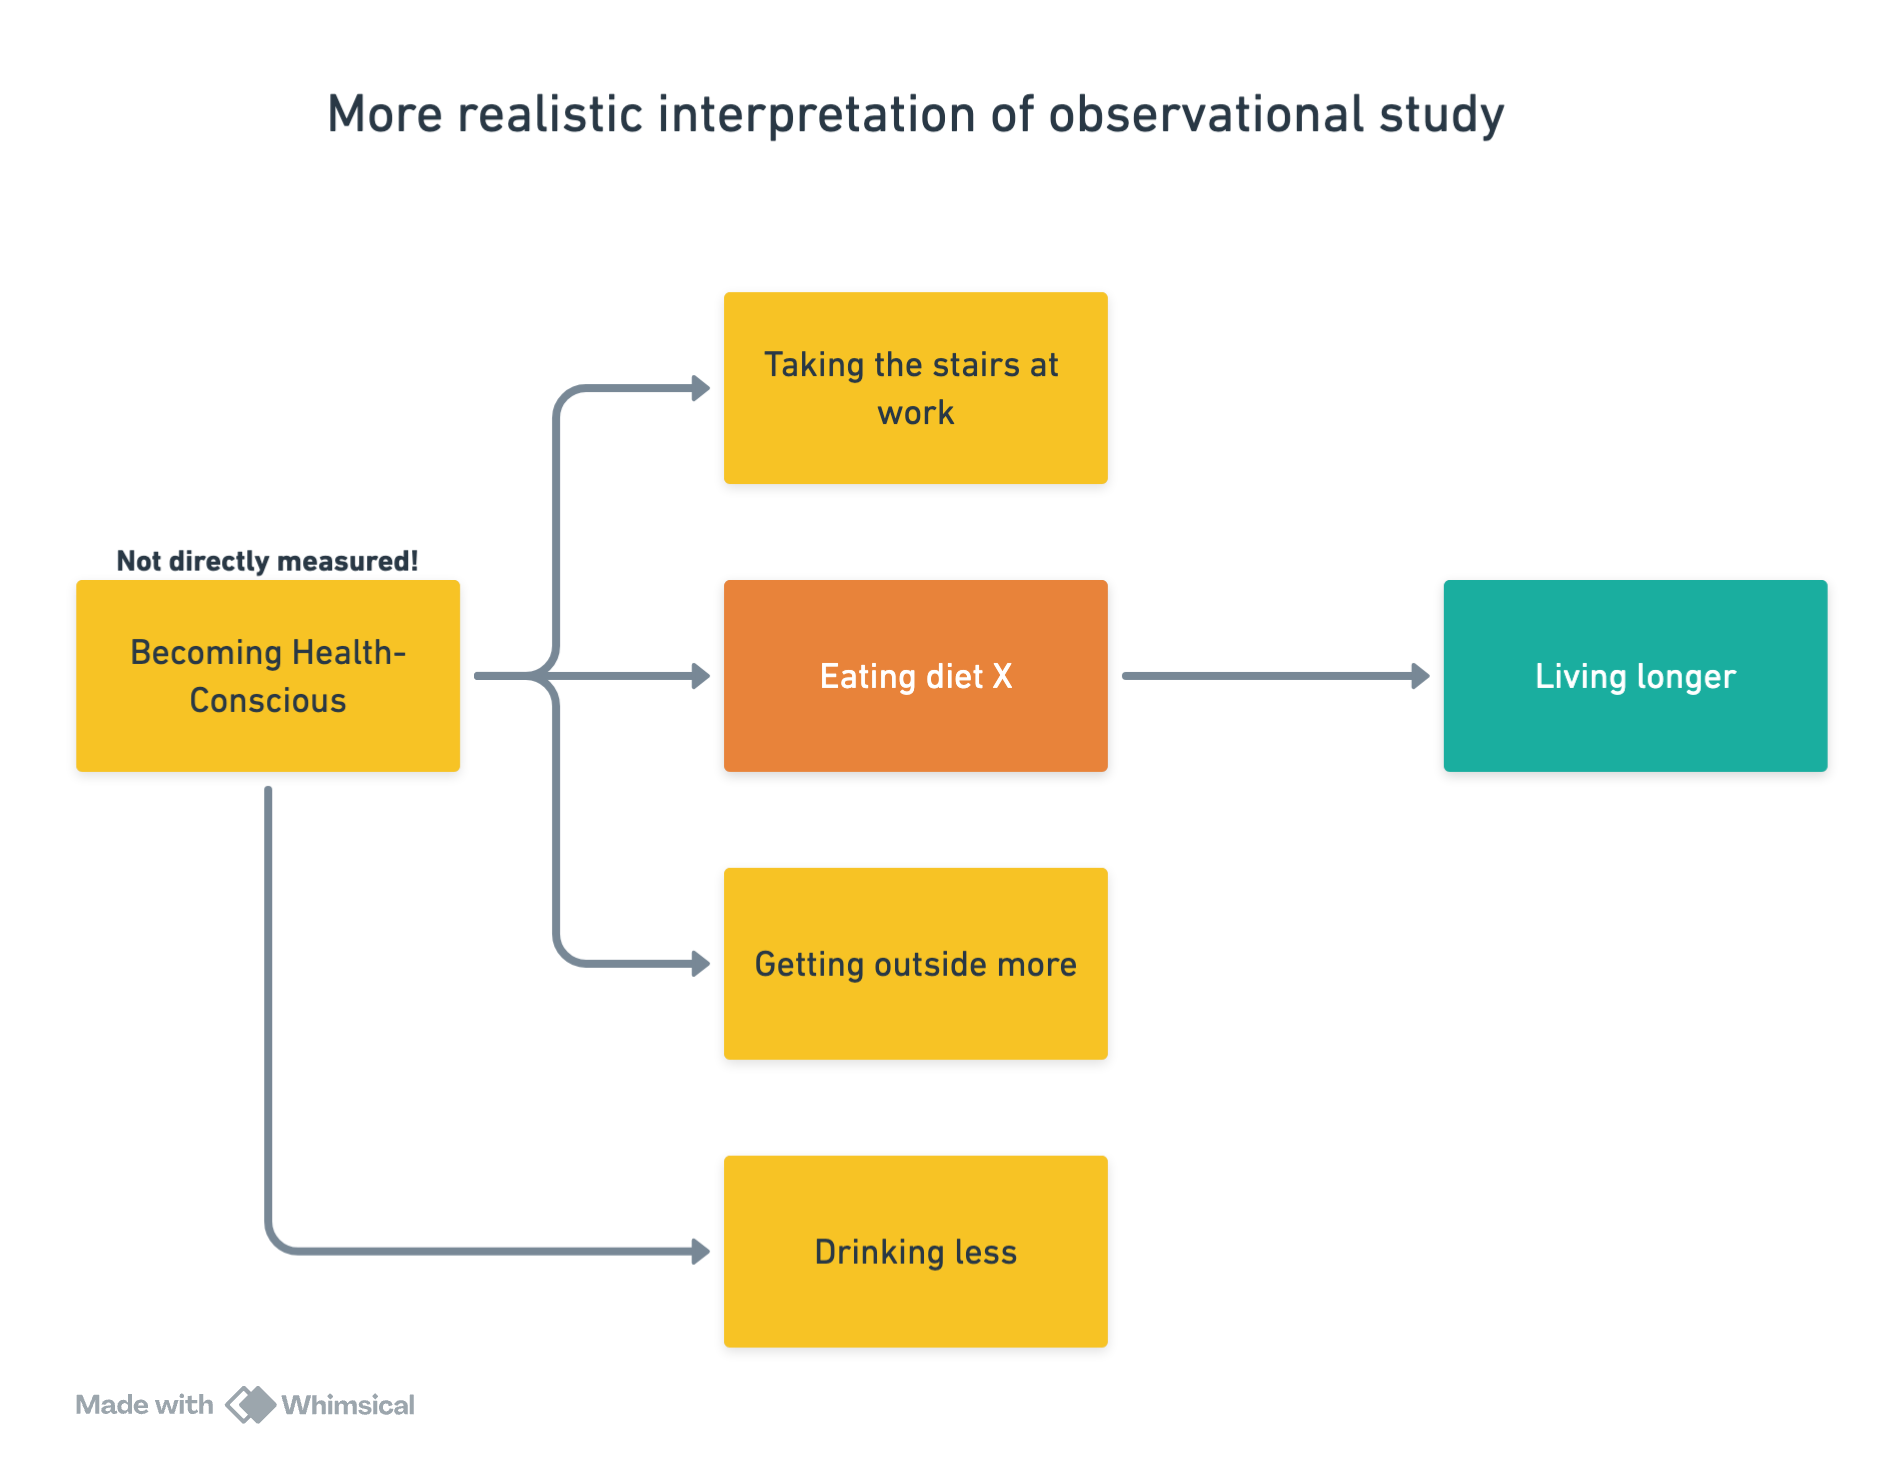
When you hear an argument of the form “doing X leads to Y” if you get into the habit asking if there is plausibly anything that causes X, and therefore indirectly causes Y, or which causes both X and Y, then you will start to see holes in lots of those types of arguments.
These unstated factors (becoming health conscious in the diet example above) that influence the explicitly mentioned factors (eating a specific diet) are called confounding or lurking variables.
Backward-looking predictions
It’s very easy to find these types of correlations in a large historical data set.
The financial website The Motley Fool once looked back at the most successful stocks in a given time period in order to recommend which stocks to invest in for the future.
They found various financial indicators in common among all of the stocks that greatly increased in value during that historical time period.
But if you followed the performance of those stocks in the years following the article, or picked new stocks with the same attributes, you would’ve been sorely disappointed. The stocks with those factors didn’t do well.
Why? In a large dataset with many dimensions you can find correlations among successful examples simply by chance.
Jason Zweig put it well in his critique of this method:
Just as we can “predict” yesterday’s weather with 100% accuracy, we already know exactly which stocks outperformed in the past. If we look long enough, we can find some attribute they share — but it’s far more likely to be a complete coincidence than an actual cause of their high returns.
To show how easy it is to concoct something that works, I tried it myself. With the help of Kevin Johnson, a money manager at Aronson & Partners in Philadelphia, I studied 10,500 stocks dating back to 1980.
Here’s what we found: Beating the market over the past two decades was a breeze. All you had to do was buy stocks whose names are spelled without repeating any letters. To heck with that Motley Fool complexity: Texaco, good (no repeated letters); Exxon, bad (two X’s). I call this the “Very Stupid” portfolio — since that title, like our stocks’ names, repeats no letters.
Finding attributes in common among the successful stocks doesn’t mean that those attributes caused the success. There likely were some lurking variables behind the scenes of that success.
In machine learning finding these kinds of spurious correlations is part of the curse of dimensionality, various challenges that arise when the number of attributes in your dataset grows very large.
Nonsense narratives
A similar thing happened with Jim Collins’ best-selling book Good to Great, in which he details companies that - in the past - were exceptional in some way.
However, those same “great” companies - including Circuit City and Fannie Mae - definitely were not great in the years following the publication of the book.
Economist Steven Levitt points out that you would have been better off investing in the S&P 500 than the 11 companies profiled in Collins’ book.
While some of the advice in the book surely is useful in the right situation, it shows how the promise of narratives based on historical data are often woefully unsuited for predicting the future⁵.
Get help
One important lesson of the replication crisis is intellectual and statistical humility.
Being intelligent, being highly educated or highly skilled in some domain doesn’t mean you are also an expert in statistics or in processing data.
A brilliant medical doctor or economist may make a silly statistical error, such as confusing correlation for causation, or considering a “significant” result as good as truth no matter how that significance was obtained.
So if you have statistical expertise at your disposal, someone on staff who is well versed in these pitfalls and how to avoid them, have the humility to seek their help.
We’ll discuss this more in part 4 of this series: things like the curse of dimensionality aren’t unsolvable problems. Far from it!
Machine learning practitioners employ a variety of techniques to address those types of issues. The problem is that the casual user of statistics may not even be aware there’s a problem to address.
Bend over backwards
Feynman continues in his speech:
I’m talking about a specific, extra type of integrity that is not not lying, but bending over backwards to show how you are maybe wrong, that you ought to have when acting as a scientist.
And this is our responsibility as scientists, certainly to other scientists, and I think to laymen.
This is what we should get in the habit of doing when we analyze data at work. Numbers are powerfully convincing. All but the most blatant misinterpretations lend credence to whatever we say.
That means we need to approach them with appropriate caution and care.
Not to say that you should avoid looking at the numbers! You certainly should.
Just be careful to look for the truth, rather than what you wish to be true.
Footnotes
- Ioannidis’s essay is not without critics, and it’s title is definitely hyperbolic. The likelihood of a scientific finding being true depends on many things, not least of which is the field in question. It would not be right to say that most published research findings in physics are false, while you would be wise to question a new finding in psychology. That said, his general critiques are widely accepted and the inability of scientists in fields such as psychology to replicate earlier studies is a real phenomenon.
- In part this is possible because traditional tests of significance are based on satisfying some arbitrary threshold. If your threshold for significance is p=0.05, what does p=0.049 mean? Or p=0.051? You need the context in which the result was obtained to say anything sensible about those results.
- Of course sometimes you really do want to slice the data a number of different ways. This is particularly true in exploratory analysis, where you really just want to get a feel for the data, rather than try to prove or disprove some specific claim. But if you’re already very familiar with the domain and are looking to answer a specific question, best to stay disciplined and force yourself to stick to a particular analysis of the data that’s been agreed upon publicly before the numbers are run.
- You can attempt to determine causality without running experiments, but that is also hard. Eg if you’re trying to “control for” what you think are the likely confounding variables, how do you know you haven’t missed any?
- For much more on this, read one of my favorite essays: Navigating the Unpredictability of Everything